File:Naa newspaper ad revenue.svg

此 SVG 檔案的 PNG 預覽的大小:511 × 335 像素。 其他解析度:320 × 210 像素 | 640 × 420 像素 | 1,024 × 671 像素 | 1,280 × 839 像素 | 2,560 × 1,678 像素。
原始檔案 (SVG 檔案,表面大小:511 × 335 像素,檔案大小:71 KB)
摘要
| 描述 |
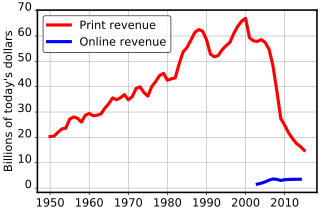
English: US newspaper advertising revenue, corrected for inflation |
| 日期 | |
| 來源 |
自己的作品 |
| 作者 | Dave Farrance |
| SVG開發 | 本vector image使用Matplotlib創作。 |
| 原始碼 | Python code#!/usr/bin/env python3
from matplotlib.pylab import *
print1950=[2070,2251,2464,2632,2685,3077,3223,3268,3176,3526,3681,3601,3659,
3780,4120,4426,4865,4910,5232,5714,5704,6167,6939,7481,7842,8234,9618,
10751,12213,13863,14794,16527,17694,20581,23522,25170,26990,29412,31197,
32368,32280,30349,30639,31869,34109,36092,38075,41330,43925,46289,48670,
44305,44102,44939,46703,47408,46611,42209,34740,24821,22795,20692,18931,
17300, 16400, 14870]
onlin2003=[1216,1541,2027,2664,3166,3109,2743,3042,3249,3340,3420,3500]
infla1950=[1.3,7.9,1.9,0.8,0.7,-0.4,1.5,3.3,2.8,0.7,1.7,1.0,1.0,1.3,
1.3,1.6,2.9,3.1,4.2,5.5,5.7,4.4,3.2,6.2,11.0,9.1,5.8,6.5,7.6,11.3,13.5,
10.3,6.2,3.2,4.3,3.6,1.9,3.6,4.1,4.8,5.4,4.2,3.0,3.0,2.6,2.8,3.0,2.3,1.6,
2.2,3.4,2.8,1.6,2.3,2.7,3.4,3.2,2.8,3.8,-0.4,1.6,3.2,2.1,1.5,1.6,0.1]
corr1950= array( [0.001]*len(infla1950) )
for j in range(len(corr1950) - 2, -1, -1):
corr1950[j] = corr1950[j+1] * ((100.0 + infla1950[j+1]) / 100.0)
rc('axes', lw=2.0)
plot(range(1950, 1950 + len(print1950)), print1950 * corr1950,
'r-', lw=4.0, label='Print revenue')
plot(range(2003, 2003 + len(onlin2003)),
onlin2003 * corr1950[2003 - 1950: 2003 - 1950 + len(onlin2003)],
'b-', lw=4.0, label='Online revenue')
xticks(size=14.5)
yticks(size=14.5,va='baseline')
grid(lw=0.75)
ylabel("Billions of today\'s dollars", size=14.5)
rc('legend', fontsize=14.5, edgecolor="black"); legend(loc=2)
savefig('naa_newspaper_ad_revenue.svg')
show()
|
授權條款
With the proviso that some rights to the numerical source data may be retained by the Newspaper Association of America, I release the graph and its source program to the public domain.
我,本作品的著作權持有者,決定用以下授權條款發佈本作品:
| 此檔案在創用CC CC0 1.0 通用公有領域貢獻宣告之下分發。 | |
| 在此宣告之下分發本作品者,已依據各國著作權法,在全世界放棄其對本作品所擁有的著作權及所有相關相似的法律權利,從而將本作品貢獻至公有領域。您可以複製、修改、分發和演示該作品,用於任何商業用途,所有這些都不需要請求授權。
|
檔案歷史
點選日期/時間以檢視該時間的檔案版本。
| 日期/時間 | 縮圖 | 尺寸 | 使用者 | 備註 | |
|---|---|---|---|---|---|
| 目前 | 2018年8月27日 (一) 18:37 | | 511 × 335(71 KB) | Farry | Correction to inflation calculation |
| 2018年8月27日 (一) 09:30 |  | 513 × 324(71 KB) | Farry | Increase font size for better appearance in thumbnails | |
| 2018年8月26日 (日) 17:06 |  | 512 × 325(67 KB) | Farry | Adjust aspect-ratio and border width | |
| 2018年8月26日 (日) 15:07 |  | 508 × 364(71 KB) | Farry | Data up to 2015 (last available as of 2018) | |
| 2013年5月29日 (三) 19:29 |  | 660 × 490(77 KB) | Farry | 2012 data added | |
| 2012年9月18日 (二) 14:00 |  | 656 × 488(81 KB) | Farry | User created page with UploadWizard |
檔案用途
下列頁面有用到此檔案:
全域檔案使用狀況
以下其他 wiki 使用了這個檔案:
- ca.wikipedia.org 的使用狀況
- en.wikipedia.org 的使用狀況
- fi.wikipedia.org 的使用狀況
- fr.wikipedia.org 的使用狀況
- lt.wikipedia.org 的使用狀況
- sr.wikipedia.org 的使用狀況