File:Linear regression.svg

此 SVG 檔案的 PNG 預覽的大小:438 × 289 像素。 其他解析度:320 × 211 像素 | 640 × 422 像素 | 1,024 × 676 像素 | 1,280 × 845 像素 | 2,560 × 1,689 像素。
原始檔案 (SVG 檔案,表面大小:438 × 289 像素,檔案大小:71 KB)
摘要
本image使用SageMath創作。
| 描述 |
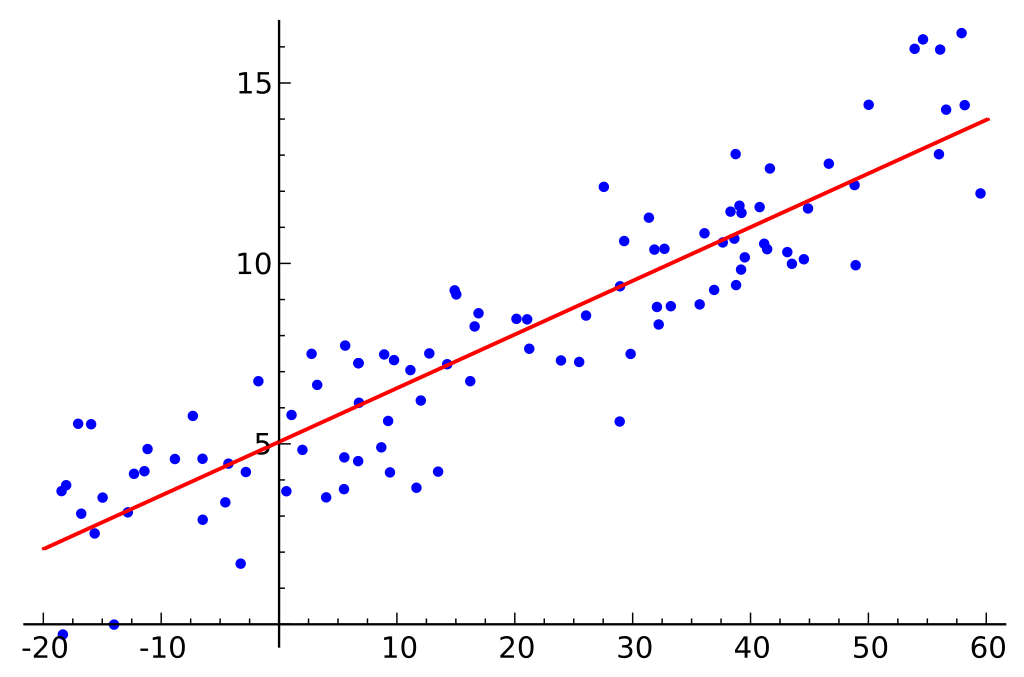
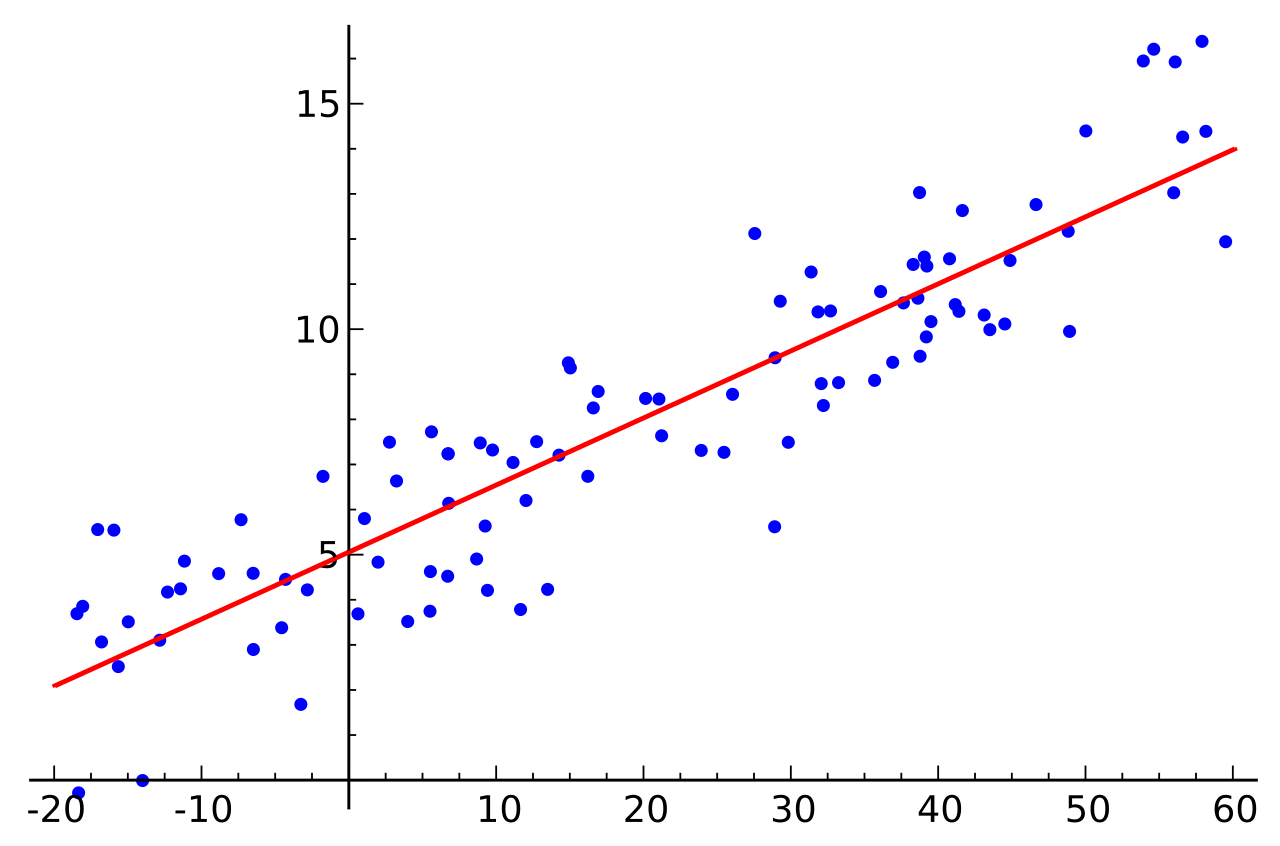
English: Random data points and their linear regression. Created with the following Sage (http://sagemath.org) commands:
X = RealDistribution('uniform', [-20, 60])

Y = RealDistribution('gaussian', 1.5)

f(x) = 3*x/20 + 5

xvals = [X.get_random_element() for _ in range(100)]

data = [(x, f(x) + Y.get_random_element()) for x in xvals]

m, b = var('m b')

g(x) = m*x + b

g(x) = g(x).subs(find_fit(data, g, solution_dict=True))

p = list_plot(data) + plot(g, (x, -20, 60), color='red')

p.save('linear_regression.svg')
|
| 日期 | |
| 來源 | 自己的作品 |
| 作者 | Sewaqu |
| 其他版本 | Derivative works of this file: Sedm zakladnich nastroju zlepsovani kvality cz.svg |
授權條款
| 我,此作品的版權所有人,釋出此作品至公共領域。此授權條款在全世界均適用。 這可能在某些國家不合法,如果是的話: 我授予任何人有權利使用此作品於任何用途,除受法律約束外,不受任何限制。 |
檔案歷史
點選日期/時間以檢視該時間的檔案版本。
| 日期/時間 | 縮圖 | 尺寸 | 使用者 | 備註 | |
|---|---|---|---|---|---|
| 目前 | 2016年3月31日 (四) 10:42 | | 438 × 289(71 KB) | RaphaelQS | transparent background |
| 2010年11月5日 (五) 03:18 |  | 438 × 289(42 KB) | Sewaqu | {{Information |Description={{en|1=Random data points and their linear regression. Created with the following Sage (http://sagemath.org) commands: X = RealDistribution('uniform', [-20, 60]) Y = RealDistribution('gaussian', 1.5) f(x) = 3*x/20 + 5 xvals |
檔案用途
下列28個頁面有用到此檔案:
全域檔案使用狀況
以下其他 wiki 使用了這個檔案:
- ar.wikipedia.org 的使用狀況
- ast.wikipedia.org 的使用狀況
- az.wikipedia.org 的使用狀況
- be.wikipedia.org 的使用狀況
- bg.wikipedia.org 的使用狀況
- bn.wikipedia.org 的使用狀況
- cs.wikipedia.org 的使用狀況
- de.wikipedia.org 的使用狀況
- el.wikipedia.org 的使用狀況
- en.wikipedia.org 的使用狀況
- en.wikiversity.org 的使用狀況
- eo.wikipedia.org 的使用狀況
- es.wikipedia.org 的使用狀況
- et.wikipedia.org 的使用狀況
- eu.wikipedia.org 的使用狀況
- fa.wikipedia.org 的使用狀況
- fr.wikipedia.org 的使用狀況
- gl.wikipedia.org 的使用狀況
檢視此檔案的更多全域使用狀況。