File:GDP Real Growth in 2009.svg

此 SVG 檔案的 PNG 預覽的大小:800 × 353 像素。 其他解析度:320 × 141 像素 | 640 × 283 像素 | 1,024 × 452 像素 | 1,280 × 565 像素 | 2,560 × 1,130 像素 | 940 × 415 像素。
原始檔案 (SVG 檔案,表面大小:940 × 415 像素,檔案大小:1.64 MB)
| 描述 |
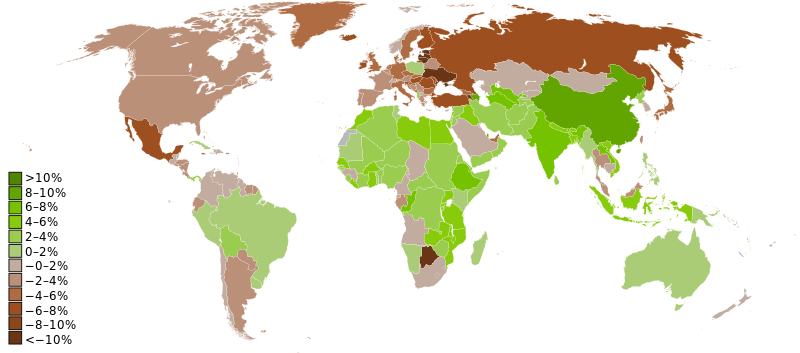
English: World map showing GDP real growth rates for 2009. CIA world factbook estimates[1] as of April 2010.
Español: World map showing GDP real growth rates for 2009. |
| 日期 | (UTC) |
| 來源 | |
| 作者 |
|
我,本作品的著作權持有者,決定用以下授權條款發佈本作品:
| 此檔案採用創用CC 姓名標示-相同方式分享 3.0 未在地化版本授權條款。 | ||
| ||
| 已新增授權條款標題至此檔案,作為GFDL授權更新的一部份。 |

|
已授權您依據自由軟體基金會發行的無固定段落、封面文字和封底文字GNU自由文件授權條款1.2版或任意後續版本,對本檔進行複製、傳播和/或修改。該協議的副本列在GNU自由文件授權條款中。 |
您可以選擇您需要的授權條款。
原始上傳日誌
This image is a derivative work of the following images:
- File:Gdp_real_growth_rate_2007_CIA_Factbook.PNG licensed with Cc-by-sa-3.0-migrated, GFDL
- 2010-04-09T05:42:31Z Kami888 1350x625 (60861 Bytes) updated to April figures
- 2010-04-06T16:51:22Z Kami888 1350x625 (60976 Bytes) removed outdated information for Guernsey, San Marino, and Liechtenstein.
- 2010-03-01T06:41:46Z Fleaman5000 1350x625 (60992 Bytes) for some reason in the old version, red meant high growth rate and green meant decline. This was counterintuitive, so I switched them.
- 2010-02-15T21:11:15Z Kami888 1350x625 (53193 Bytes) adjusted colors
- 2010-02-14T23:25:23Z Kami888 1350x625 (53177 Bytes) updated to 2010
- 2009-04-21T18:32:59Z Sbw01f 1350x625 (51648 Bytes) Reverted to version as of 22:49, 3 April 2009 Mexico grew 1.4%
- 2009-04-04T04:25:59Z Ukelay33 1355x640 (52281 Bytes) Fixed Mexico
- 2009-04-03T22:49:41Z Sbw01f 1350x625 (51648 Bytes) update
- 2009-01-23T19:43:46Z Sbw01f 1350x625 (51597 Bytes) 2008 update
- 2008-05-19T15:36:13Z Sbw01f 1350x625 (52565 Bytes)
- 2008-03-01T02:01:09Z Sbw01f 1350x625 (53003 Bytes) more fixes
- 2008-02-29T19:58:28Z Sbw01f 1350x625 (52972 Bytes) fixes
- 2008-02-28T03:01:28Z Sbw01f 1350x625 (53028 Bytes) == Summary == {{Information |Description=World map of GDP real growth rates. CIA world factbook 2007 figures |Source=self-made |Date=2008 |Author= [[User:Sbw01f|Sbw01f]] }}
- 2008-02-28T02:44:22Z Sbw01f 1350x625 (52992 Bytes) {{Information |Description=World map of GDP real growth rates. CIA world factbook 2007 figures |Source=self-made |Date=2008 |Author= [[User:Sbw01f|Sbw01f]] }}
Uploaded with derivativeFX
檔案歷史
點選日期/時間以檢視該時間的檔案版本。
| 日期/時間 | 縮圖 | 尺寸 | 使用者 | 備註 | |
|---|---|---|---|---|---|
| 目前 | 2013年9月19日 (四) 18:22 | | 940 × 415(1.64 MB) | Koavf | ndashes |
| 2010年4月19日 (一) 09:59 |  | 940 × 415(1.69 MB) | Mnmazur | {{Information |Description=World map showing GDP real growth rates for 2009. CIA world factbook estimates[https://www.cia.gov/library/publications/the-world-factbook/rankorder/2003rank.html] as of April 2010. |Source=*[[:File:Gdp_real_growth_rate_2007_CIA |
檔案用途
下列頁面有用到此檔案:
全域檔案使用狀況
以下其他 wiki 使用了這個檔案:
- ang.wikipedia.org 的使用狀況
- ar.wikipedia.org 的使用狀況
- bg.wikipedia.org 的使用狀況
- bn.wikipedia.org 的使用狀況
- bs.wikipedia.org 的使用狀況
- cs.wikipedia.org 的使用狀況
- cy.wikipedia.org 的使用狀況
- da.wikipedia.org 的使用狀況
- de.wikipedia.org 的使用狀況
- el.wikipedia.org 的使用狀況
- en.wikipedia.org 的使用狀況
- es.wikipedia.org 的使用狀況
- et.wikipedia.org 的使用狀況
- fr.wikipedia.org 的使用狀況
- gl.wikipedia.org 的使用狀況
- gu.wikipedia.org 的使用狀況
- he.wikipedia.org 的使用狀況
- hi.wikipedia.org 的使用狀況
- hy.wikipedia.org 的使用狀況
- id.wikipedia.org 的使用狀況
- it.wikipedia.org 的使用狀況
- it.wikibooks.org 的使用狀況
- it.wikiversity.org 的使用狀況
- ja.wikipedia.org 的使用狀況
- lt.wikipedia.org 的使用狀況
- mk.wikipedia.org 的使用狀況
- ms.wikipedia.org 的使用狀況
- nl.wikipedia.org 的使用狀況
- pl.wikipedia.org 的使用狀況
- pnb.wikipedia.org 的使用狀況
- pt.wikipedia.org 的使用狀況
- ru.wikipedia.org 的使用狀況
檢視此檔案的更多全域使用狀況。