File:Births and Total fertility rate of Japan.svg

此 SVG 檔案的 PNG 預覽的大小:800 × 400 像素。 其他解析度:320 × 160 像素 | 640 × 320 像素 | 1,024 × 512 像素 | 1,280 × 640 像素 | 2,560 × 1,280 像素 | 900 × 450 像素。
原始檔案 (SVG 檔案,表面大小:900 × 450 像素,檔案大小:117 KB)

|
This file may be updated to reflect new information. If you wish to use a specific version of the file without new updates being mirrored, please upload the required version as a separate file. |
摘要
| 描述 |
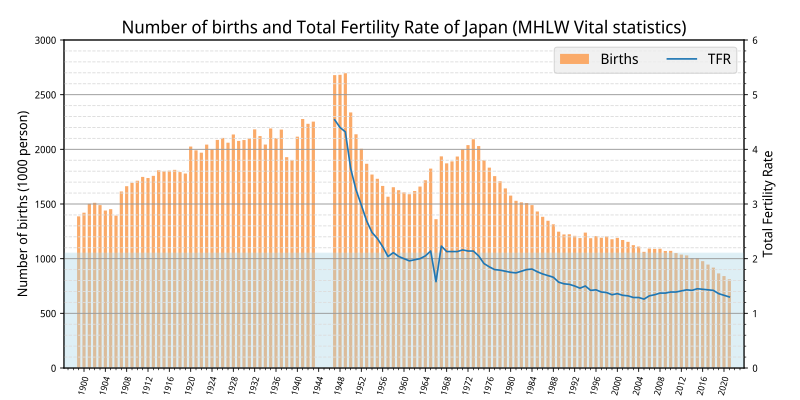
English: Births and Total fertility rate of Japan |
| 日期 | |
| 來源 |
自己的作品, Data from
|
| 作者 | Yuasan |
| 授權許可 (重用此檔案) |
CC-0 |
授權條款
我,本作品的著作權持有者,決定用以下授權條款發佈本作品:
| 此檔案在創用CC CC0 1.0 通用公有領域貢獻宣告之下分發。 | |
| 在此宣告之下分發本作品者,已依據各國著作權法,在全世界放棄其對本作品所擁有的著作權及所有相關相似的法律權利,從而將本作品貢獻至公有領域。您可以複製、修改、分發和演示該作品,用於任何商業用途,所有這些都不需要請求授權。
|
graph data
import matplotlib.pyplot as plt
from cycler import cycler
import pandas as pd
import numpy as np

df = pd.read_csv("data.tsv", index_col=0 , sep = "\t")

df1 = df.T.loc['TFR']		# line
df1 = df1.fillna(method='ffill')
df2 = df.T.loc['Births'].div(1000)	# bar

fig, ax = plt.subplots(figsize=(10, 5))
ax2 = ax.twinx()
plt.rcParams['font.family'] = 'sans-serif'
plt.rcParams['font.sans-serif'] = ['Noto Sans Display']

plt.subplots_adjust(left=0.08, bottom=0.08, right=0.93, top=0.90)

ax.bar(df2.index, df2, color="#FAAA69", width=0.6, label="Births")
ax.set_axisbelow(True)
ax.tick_params(axis='x', labelrotation=75)
ax.set_ylabel("Number of births (1000 person)", fontsize=12)
ax.set_ylim([0,3000])

ax2.set_ylabel("Total Fertility Rate", fontsize=12)
ax2.set_ylim([0,6])
ax2.axhspan(0,2.1, color="lightblue", alpha=0.4 , zorder=-10)
ax2.set_prop_cycle( plt.rcParams['axes.prop_cycle'] )
ax2.plot(df1, label="TFR")

ax.margins(0.02)
ax2.margins(0.02)

lines, labels = ax.get_legend_handles_labels()
lines2, labels2 = ax2.get_legend_handles_labels()
ax2.legend(lines + lines2, labels + labels2, facecolor="#eeeeee" ,
           ncol=2, fontsize=13,loc='upper right')

plt.title("Number of births and Total Fertility Rate of Japan (MHLW Vital statistics)", fontsize=16)

plt.setp(ax.get_xticklabels(), fontsize=8)
plt.setp(ax.get_yticklabels(), fontsize=9)
plt.xticks(np.arange(1900, 2021, step=4), fontsize=9)
plt.tick_params(labelsize=9, pad=4)

plt.minorticks_on()
plt.grid(which='major',color='#999999',linestyle='-', axis="y")
plt.grid(which='minor',color='#dddddd',linestyle='--', axis="y")

plt.savefig("image.svg")
檔案歷史
點選日期/時間以檢視該時間的檔案版本。
| 日期/時間 | 縮圖 | 尺寸 | 使用者 | 備註 | |
|---|---|---|---|---|---|
| 目前 | 2023年8月1日 (二) 13:31 | | 900 × 450(117 KB) | Yuasan | stretch |
| 2023年1月3日 (二) 12:47 |  | 1,080 × 540(121 KB) | Yuasan | ipss data | |
| 2023年1月3日 (二) 12:25 |  | 1,080 × 540(121 KB) | Yuasan | fix TFR | |
| 2022年12月30日 (五) 13:51 |  | 1,080 × 540(89 KB) | Yuasan | Uploaded own work with UploadWizard |
檔案用途
下列頁面有用到此檔案:
全域檔案使用狀況
以下其他 wiki 使用了這個檔案:
- en.wikipedia.org 的使用狀況
- it.wikipedia.org 的使用狀況
- ja.wikipedia.org 的使用狀況
- ko.wikipedia.org 的使用狀況
- uk.wikipedia.org 的使用狀況