File:Temp-sunspot-co2.svg

此 SVG 檔案的 PNG 預覽的大小:720 × 540 像素。 其他解析度:320 × 240 像素 | 640 × 480 像素 | 1,024 × 768 像素 | 1,280 × 960 像素 | 2,560 × 1,920 像素。
原始檔案 (SVG 檔案,表面大小:720 × 540 像素,檔案大小:98 KB)
摘要
| 描述 |
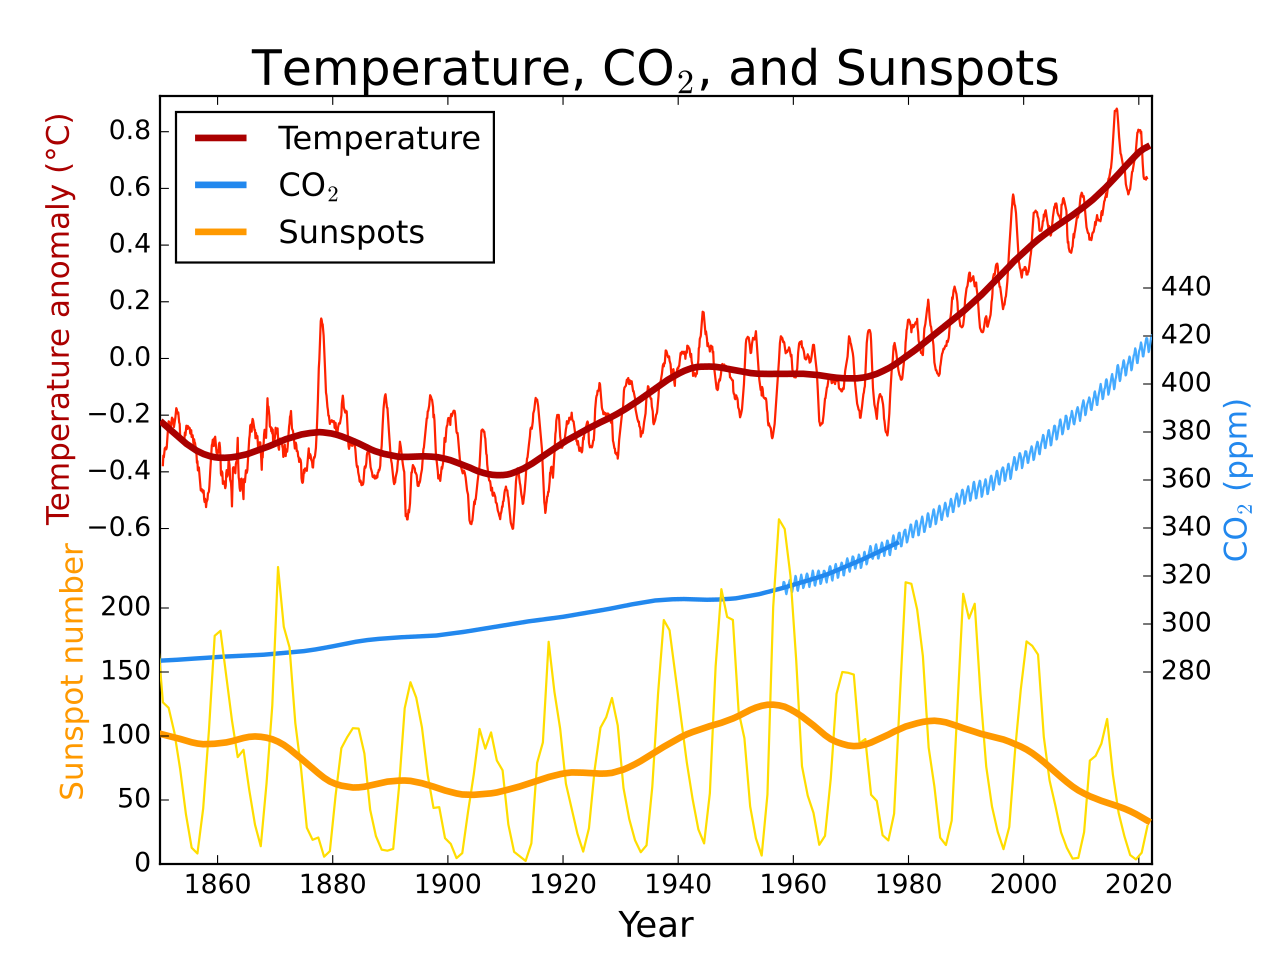
English: Global average temperature, atmospheric CO2, and sunspot activity since 1850. Thick lines for temperature and sunspots represent a 25 year LOWESS and moving average smoothing of the raw data. |
||
| 日期 | 2009年一月11日 (原始上傳日期) | ||
| 來源 | Transferred from en.wikipedia to Commons by Anrie using CommonsHelper. | ||
| 作者 | 英文維基百科的Leland McInnes | ||
| 其他版本 |
|
||
| SVG開發 | 本向量圖形使用Matplotlib創作。
Global average temperature, atmospheric CO2, and sunspot activity since 1850. Thick lines for temperature and sunspots represent a 25 year moving average smoothing of the raw data. This figure was produced by Leland McInnes using python and matplotlib and is licensed under the GFDL. All data is from publicly available sources.
| ||
| 原始碼 | Python code#! /usr/bin/env python3
# -*- coding: utf-8 -*-
import numpy as np
import matplotlib.pylab as plt
import matplotlib.ticker as ticker
import urllib3
import ftplib
import shutil
plt.rcdefaults()
plt.style.use('classic')
def saveurl(url, fname):
if url.startswith("ftp"):
ftp = ftplib.FTP('/'.join(url.split('/')[2:3]))
ftp.login('', '')
with open(fname, 'wb') as f:
res = ftp.retrbinary('RETR %s' % '/'.join(url.split('/')[3:]), f.write)
else:
c = urllib3.PoolManager()
with c.request('GET', url, preload_content=False) as resp, open(fname, 'wb') as out_file:
shutil.copyfileobj(resp, out_file)
print('saved', fname, 'from', url)
def smooth_convolution(signal, window_size):
window_size = 1 + 2 * (window_size // 2) # should be odd
w = np.hamming(window_size)
y = (np.convolve(w, signal) / np.convolve(w, np.ones_like(signal)))
return y[(len(w)-1)//2:-(len(w)//2)]
def smooth_lowess(signal, window_size):
s = window_size // 2
window = np.hamming(1+2*s) / np.hamming(1+2*s).sum()
smoothed = np.empty_like(signal)
for i in range(len(signal)):
i0, i1 = max(i-s, 0), min(i+s, len(signal)-1) + 1
# linear LOWESS smoothing
smoothed[i] = np.poly1d(np.polyfit(np.arange(i0, i1), signal[i0:i1], deg=1,
w=np.sqrt(window[i0-i+s:i1-i+s])))(i)
return smoothed
saveurl("http://woodfortrees.org/data/hadcrut4gl/mean:12", "hadcrut4gl.txt")
with open("hadcrut4gl.txt") as temp_file:
temp_years, temps = [], []
for l in temp_file.readlines():
yT = l.split()
if (not l.startswith('#')) and len(yT) == 2:
temp_years.append(float(yT[0]))
temps.append(float(yT[1]))
#print('T', list(zip(temp_years, temps)))
saveurl("ftp://aftp.cmdl.noaa.gov/products/trends/co2/co2_mm_mlo.txt", "co2_mm_mlo.dat")
with open("co2_mm_mlo.dat") as co2_file:
data_rows = [x.split() for x in co2_file if not x.startswith("#") and x.find("-99.99") == -1]
co2_years = [float(x[2]) for x in data_rows]
co2concs = [float(x[3]) for x in data_rows]
#print('co2', list(zip(co2_years, co2concs)))
saveurl("ftp://ftp.ncdc.noaa.gov/pub/data/paleo/icecore/antarctica/law/law_co2.txt", "law_co2.txt")
with open("law_co2.txt", encoding="ISO-8859-1") as lawco2_file:
data_rows = [x.split() for x in lawco2_file if x.startswith(" 1")]
del data_rows[ [float(x[0]) for x in data_rows].index(1010.):]
lawco2_years = [float(x[0]) for x in data_rows]
lawco2concs = [float(x[-1]) for x in data_rows]
#print('lawco2', list(zip(lawco2_years, lawco2concs)))
saveurl("http://www.sidc.be/silso/DATA/SN_y_tot_V2.0.txt", "yearssn.dat")
with open("yearssn.dat") as sunspot_file:
data_rows = [x.split() for x in sunspot_file if "*" not in x]
sun_years = [float(x[0]) for x in data_rows]
sunspots = [float(x[1]) for x in data_rows]
#print('sunspots', list(zip(sun_years, sunspots)))
t_min, t_max = 1850, max(temp_years[-1], co2_years[-1], sun_years[-1])
smoothed_temps = smooth_lowess(temps, 25 * 12)
smoothed_sunspots = smooth_convolution(sunspots, 25)
rect = [0.125, 0.1, 0.775, 0.8]
base_ax = plt.axes(rect)
base_ax.yaxis.tick_left()
plt.yticks([])
plt.xlim(t_min, t_max)
plt.gca().xaxis.set_major_locator(ticker.MultipleLocator(20))
plt.xlabel("Year", size=16)
plt.title(r"Temperature, CO$_2$, and Sunspots", size=22)
temp_ax = plt.axes([rect[0],rect[1]+.42*rect[3],rect[2],.58*rect[3]], frameon=False)
temp_ax.yaxis.tick_left()
plt.plot(temp_years, temps, '#FF2200')
tline = plt.plot(temp_years, smoothed_temps, '#AA0000', lw=3)
plt.xlim(t_min, t_max)
plt.ylim(min(temps)*1.03 - 0.03*max(temps), max(temps)*1.03 - 0.03*min(temps))
plt.yticks(np.arange(-0.6,0.9,0.2))
plt.ylabel(u'Temperature anomaly (°C)', size=14, color='#AA0000')
plt.xticks([])
co2_ax = plt.axes([rect[0],rect[1]+.25*rect[3],rect[2],.5*rect[3]], frameon=False)
co2_ax.yaxis.tick_right()
co2_ax.yaxis.set_label_position("right")
co2_ax.xaxis.tick_bottom()
plt.plot(co2_years, co2concs, '#44AAFF')
cline = plt.plot(lawco2_years, lawco2concs, '#2288EE', lw=2)
plt.xlim(t_min, t_max)
plt.ylabel(r'CO$_2$ (ppm)', size=14, color='#2288EE')
plt.xticks([])
sun_ax = plt.axes([rect[0],rect[1],rect[2],.5*rect[3]], frameon=False)
sun_ax.yaxis.tick_left()
plt.plot(sun_years, sunspots, "#FFDD00")
sline = plt.plot(sun_years, smoothed_sunspots, "#FF9900", lw=3)
plt.xlim(t_min, t_max)
plt.yticks(np.arange(0,250,50))
plt.ylabel("Sunspot number", size=14, color='#FF9900')
plt.xticks([])
plt.sca(base_ax)
t_proxy = plt.Line2D([0], [0], c='#AA0000', lw=3)
c_proxy = plt.Line2D([0], [0], c='#2288EE', lw=3)
s_proxy = plt.Line2D([0], [0], c='#FF9900', lw=3)
plt.legend((t_proxy, c_proxy, s_proxy), ("Temperature", r"CO$_2$", "Sunspots"), loc="upper left")
plt.savefig("Temp-co2-sunspot.svg")
plt.show()
|


Related Images


授權條款
Leland McInnes 位于英语维基百科,此作品的版權所有人,決定用以下授權條款發佈本作品:
| 此檔案採用共享創意 姓名標示-相同方式分享 3.0 未在地化版本授權條款。 受免責聲明的約束。 | ||
| 姓名標示: Leland McInnes 位于英语维基百科 | ||
| ||
| 已新增授權條款標題至此檔案,作為GFDL授權更新的一部份。 |

|
已授權您依據自由軟體基金會發行的無固定段落、封面文字和封底文字GNU自由文件授權條款1.2版或任意後續版本,對本檔進行複製、傳播和/或修改。該協議的副本列在GNU自由文件授權條款中。 受免責聲明的約束。 |
原始上傳日誌
The original description page was here. All following user names refer to en.wikipedia.
- 2009-01-11 03:45 Leland McInnes 720×540× (102750 bytes)
- 2008-10-09 00:57 Leland McInnes 600×480× (34962 bytes)
- 2007-03-11 02:47 Leland McInnes 600×480× (48910 bytes) Fix for wrong data selection
- 2007-03-11 02:10 Leland McInnes 600×480× (48672 bytes) Update to Had CRUT3 instead of CRUTEM
- 2007-03-10 20:46 Leland McInnes 600×480× (48525 bytes)
- 2007-03-10 20:41 Leland McInnes 600×480× (47761 bytes)
- 2007-03-10 05:01 Leland McInnes 600×480× (33704 bytes) Global average temperature, Mauna Loa CO<sub>2</sub>, and sunspot activity for the last 50 years.
檔案歷史
點選日期/時間以檢視該時間的檔案版本。
| 日期/時間 | 縮圖 | 尺寸 | 用戶 | 備註 | |
|---|---|---|---|---|---|
| 目前 | 2022年5月30日 (一) 20:23 | | 720 × 540(98 KB) | Geek3 | update 2022-04 |
| 2021年4月9日 (五) 13:11 |  | 720 × 540(106 KB) | Geek3 | update 2021-04 | |
| 2020年6月26日 (五) 13:04 |  | 720 × 540(105 KB) | Geek3 | data update 2020-05, enlarge temperature y-axis | |
| 2020年3月6日 (五) 15:10 |  | 720 × 540(107 KB) | Geek3 | update with 2020 data | |
| 2014年6月22日 (日) 22:15 |  | 720 × 540(76 KB) | Kopiersperre | switch from hadcrut3 to hadcrut4 | |
| 2014年3月11日 (二) 20:27 |  | 720 × 540(62 KB) | Kopiersperre | update | |
| 2012年6月25日 (一) 21:04 |  | 731 × 551(75 KB) | Johnanth | New version pulled from file discussion, based on the newly updated Python script. | |
| 2011年6月20日 (一) 18:38 |  | 731 × 551(69 KB) | Killiondude | http://m8y.org/tmp/wikipedia/ Someone was kind enough to use updated stats and redo it. | |
| 2009年5月4日 (一) 12:10 |  | 720 × 540(100 KB) | File Upload Bot (Magnus Manske) | {{BotMoveToCommons|en.wikipedia|year={{subst:CURRENTYEAR}}|month={{subst:CURRENTMONTHNAME}}|day={{subst:CURRENTDAY}}}} {{Information |Description={{en|__NOTOC__ Global average temperature, atmospheric CO<sub>2</sub>, and sunspot activity since 1850. Thi |
檔案用途
下列3個頁面有用到此檔案:
全域檔案使用狀況
以下其他 wiki 使用了這個檔案:
- be.wikipedia.org 的使用狀況
- bn.wikipedia.org 的使用狀況
- ca.wikipedia.org 的使用狀況
- de.wikipedia.org 的使用狀況
- en.wikipedia.org 的使用狀況
- en.wikiversity.org 的使用狀況
- es.wikipedia.org 的使用狀況
- fa.wikipedia.org 的使用狀況
- fr.wikipedia.org 的使用狀況
- hu.wikipedia.org 的使用狀況
- ig.wikipedia.org 的使用狀況
- it.wikipedia.org 的使用狀況
- ko.wikipedia.org 的使用狀況
- pt.wikipedia.org 的使用狀況
- ru.wikipedia.org 的使用狀況
- sr.wikipedia.org 的使用狀況
- tr.wikipedia.org 的使用狀況
- uk.wikipedia.org 的使用狀況