File:Life expectancy vs healthcare spending.jpg

預覽大小:619 × 599 像素。 其他解析度:248 × 240 像素 | 496 × 480 像素 | 793 × 768 像素 | 1,058 × 1,024 像素 | 1,876 × 1,816 像素。
原始檔案 (1,876 × 1,816 像素,檔案大小:553 KB,MIME 類型:image/jpeg)
摘要
| 描述 |
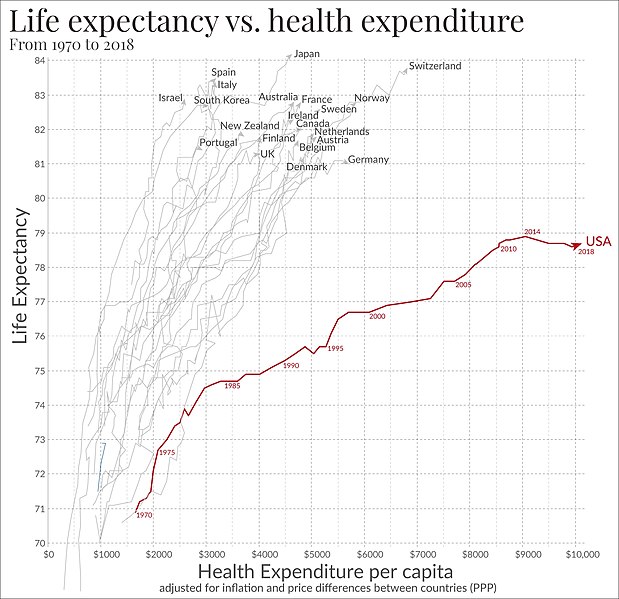
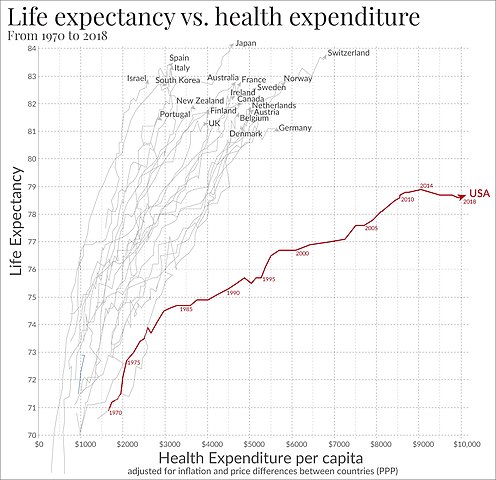
English: Life expectancy compared to healthcare spending per capita by country from 1970 to 2018, in the US and other rich OECD countries. US average of $10,447 in 2018. See en:List of countries by total health expenditure per capita. See the sources tab of the original article linked below. It says the definition of health spending given by the OECD is the following: "Health spending measures the final consumption of health care goods and services (i.e. current health expenditure) including personal health care (curative care, rehabilitative care, long-term care, ancillary services and medical goods) and collective services (prevention and public health services as well as health administration), but excluding spending on investments. Health care is financed through a mix of financing arrangements including government spending and compulsory health insurance (“public”) as well as voluntary health insurance and private funds such as households’ out-of-pocket payments, NGOs and private corporations (“private”). This indicator is presented as a total and by type of financing (“public”, “private”, “out-of-pocket”) and is measured as a share of GDP, as a share of total health spending and in USD per capita (using economy-wide PPPs)." |
| 日期 | - date of original publication of Max Roser article. Since updated. |
| 來源 | Link between health spending and life expectancy: US is an outlier. May 26, 2017. By Max Roser at Our World in Data. Click the sources tab under the chart for info on the countries, healthcare expenditures, and data sources. See the later version of the chart here. |
| 作者 | Max Roser |
| 授權許可 (重用此檔案) |
CC-BY-SA-4.0 |
| 其他版本 | Earliest uploads are of a chart adapted from one found in "America’s inefficient health-care system: another look". Consider the Evidence (blog) by Lane Kenworthy. |
授權條款
此檔案採用共享創意 姓名標示-相同方式分享 4.0 國際授權條款。
- 您可以自由:
- 分享 – 複製、發佈和傳播本作品
- 重新修改 – 創作演繹作品
- 惟需遵照下列條件:
- 姓名標示 – 您必須指名出正確的製作者,和提供授權條款的連結,以及表示是否有對內容上做出變更。您可以用任何合理的方式來行動,但不得以任何方式表明授權條款是對您許可或是由您所使用。
- 相同方式分享 – 如果您利用本素材進行再混合、轉換或創作,您必須基於如同原先的相同或兼容的條款,來分布您的貢獻成品。
檔案歷史
點選日期/時間以檢視該時間的檔案版本。
| 日期/時間 | 縮圖 | 尺寸 | 用戶 | 備註 | |
|---|---|---|---|---|---|
| 目前 | 2022年3月11日 (五) 18:52 | | 1,876 × 1,816(553 KB) | Timeshifter | Latest graph from source. |
| 2017年2月9日 (四) 00:07 |  | 1,805 × 1,747(559 KB) | EllenCT | higher resolution; cropped | |
| 2017年2月8日 (三) 23:55 |  | 550 × 623(126 KB) | EllenCT | more detailed presentation of the same data | |
| 2012年9月12日 (三) 04:38 |  | 286 × 285(27 KB) | Cupco | crop out caption text | |
| 2012年9月12日 (三) 02:50 |  | 321 × 328(32 KB) | Cupco | User created page with UploadWizard |
檔案用途
下列4個頁面有用到此檔案:
全域檔案使用狀況
以下其他 wiki 使用了這個檔案:
- en.wikipedia.org 的使用狀況
- Life expectancy
- Health system
- Life extension
- Social services
- Health care
- Health economics
- Healthcare industry
- Universal health care
- Comparison of the healthcare systems in Canada and the United States
- Healthcare in Canada
- Portal:Medicine
- Economic history of the United States
- Healthcare in Europe
- Healthcare reform in the United States
- Healthcare reform debate in the United States
- List of countries by total health expenditure per capita
- Health care reforms proposed during the Obama administration
- Healthcare in the United States
- List of countries by health insurance coverage
- Talk:United States/Archive 47
- List of countries by total health expenditure by type of financing
- Talk:United States/Archive 89
- User:Prototyperspective/Timeline of governance and policy studies 2020–present
- Health spending as percent of gross domestic product (GDP) by country
- en.wikiquote.org 的使用狀況
- et.wikipedia.org 的使用狀況
- fr.wikipedia.org 的使用狀況
- hy.wikipedia.org 的使用狀況
- pt.wikipedia.org 的使用狀況
- ro.wikipedia.org 的使用狀況
- tr.wikipedia.org 的使用狀況
- uz.wikipedia.org 的使用狀況
- vi.wikipedia.org 的使用狀況