File:US timeline. Prescription opioid pain reliever deaths.jpg

本预览的尺寸:800 × 600像素。 其他分辨率:320 × 240像素 | 640 × 480像素 | 1,024 × 768像素 | 1,200 × 900像素。
原始文件 (1,200 × 900像素,文件大小:184 KB,MIME类型:image/jpeg)

|
File:US timeline. Prescription opioid pain reliever deaths.svg是此文件的矢量版本。 如果此文件质量不低于原点阵图,就应该将这个JPG格式文件替换为此文件。
File:US timeline. Prescription opioid pain reliever deaths.jpg → File:US timeline. Prescription opioid pain reliever deaths.svg
更多信息请参阅Help:SVG/zh。 |
 |
摘要
| 描述 |
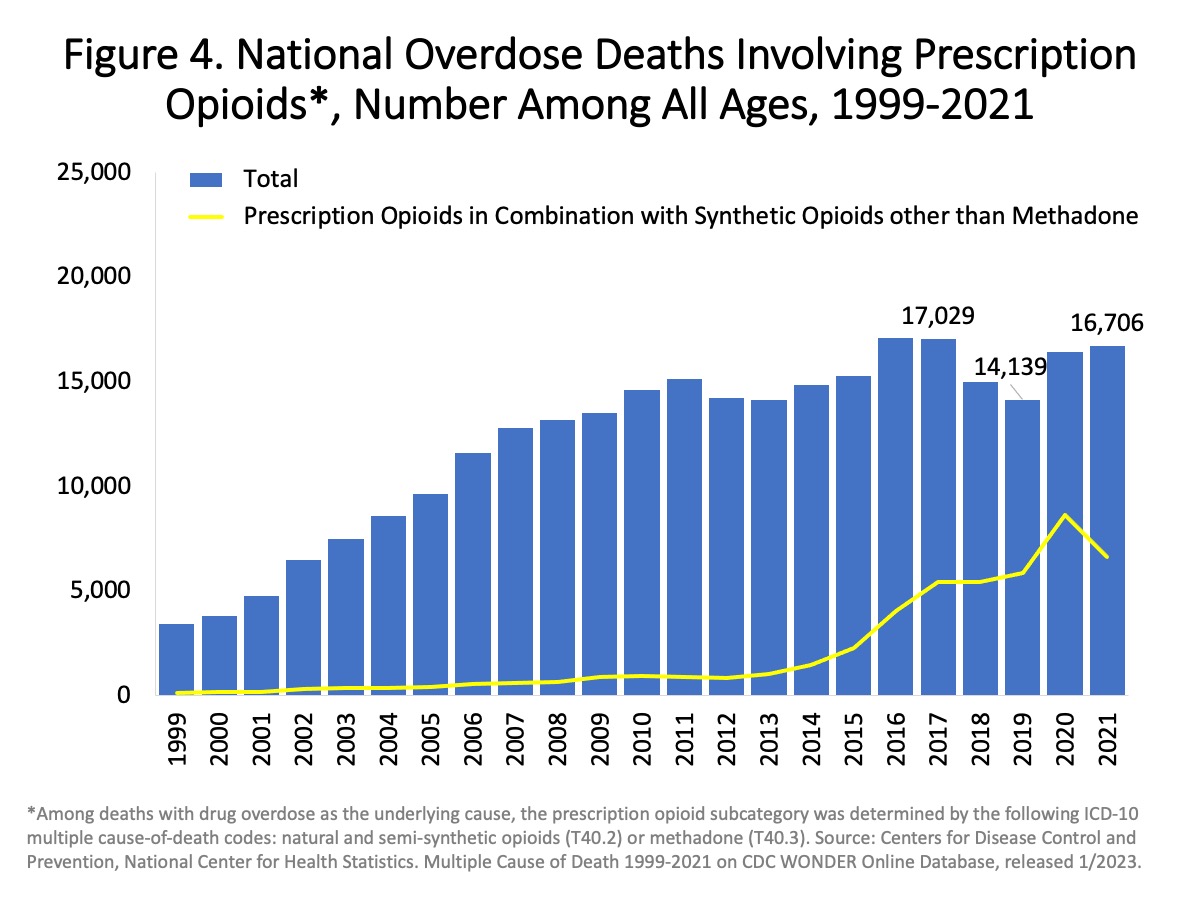
English: "Figure 4. National Overdose Deaths Involving Prescription Opioids, by other Opioid Involvement—Number Among All Ages, 1999-2021. The figure above is a bar and line graph showing the total number of U.S. overdose deaths involving prescription opioids (including natural and semi-synthetic opioids and methadone) from 1999 to 2021. Drug overdose deaths involving prescription opioids rose from 3,442 in 1999 to 17,029 in 2017. From 2017 to 2019, the number of deaths declined to 14,139. This was followed by a slight increase in 2020, with 16,416 reported deaths. In 2021, the number of reported deaths involving prescription opioids totaled 16,706. The bars are overlaid by a line showing the number of deaths involving prescription opioids in combination with synthetic opioids other than methadone (primarily fentanyl) from 1999 to 2021 (Source: CDC WONDER)." |
| 日期 | - date of first upload to the Commons. See file history for dates of later uploads. |
| 来源 | From Overdose Death Rates. By National Institute on Drug Abuse (NIDA). 1999-2021 chart. 1999-2019 chart. 2002-2016 chart. 2002-2015 chart. |
| 作者 | National Institute on Drug Abuse. Some charts were cropped to lessen outer white space. Some had "USA" added to it. Freeware IrfanView was used. The edited charts are under the same public domain license. See Commons:Convert tables and charts to wiki code or image files, and the section about adding text to chart images. |
许可协议
此圖像為美國衛生與公眾服務部下屬國家衛生院(NIH)僱員於公務中所拍攝或製作之作品。作為美國聯邦政府的作品,此圖像屬於公有領域。
 |
||
| 本文件已被确认为免除已知的著作权法限制(包括所有相关权利)。 | ||
文件历史
点击某个日期/时间查看对应时刻的文件。
| 日期/时间 | 缩略图 | 大小 | 用户 | 备注 | |
|---|---|---|---|---|---|
| 当前 | 2023年7月12日 (三) 19:01 | | 1,200 × 900(184 KB) | Timeshifter | Latest version |
| 2021年10月24日 (日) 13:18 |  | 1,150 × 868(198 KB) | Timeshifter | Latest chart from source. | |
| 2018年9月6日 (四) 14:47 |  | 805 × 587(103 KB) | Timeshifter | new version | |
| 2017年10月29日 (日) 13:24 |  | 857 × 662(122 KB) | Timeshifter | Newer chart from same source. | |
| 2015年12月29日 (二) 07:15 |  | 835 × 592(109 KB) | Timeshifter | User created page with UploadWizard |
文件用途
全域文件用途
以下其他wiki使用此文件:
- ar.wikipedia.org上的用途
- en.wikipedia.org上的用途
- hy.wikipedia.org上的用途
- it.wikipedia.org上的用途
- ja.wikipedia.org上的用途
- sr.wikipedia.org上的用途