File:US timeline. Number of overdose deaths from all drugs.jpg

原始文件(1,200 × 900像素,文件大小:180 KB,MIME类型:image/jpeg


File:US timeline. Number of overdose deaths from all drugs.svg是此文件的矢量版本。 如果此文件质量不低于原点阵图,就应该将这个JPG格式文件替换为此文件。

File:US timeline. Number of overdose deaths from all drugs.jpg → File:US timeline. Number of overdose deaths from all drugs.svg

更多信息请参阅Help:SVG/zh

其他语言
Alemannisch  Bahasa Indonesia  Bahasa Melayu  British English  català  čeština  dansk  Deutsch  eesti  English  español  Esperanto  euskara  français  Frysk  galego  hrvatski  Ido  italiano  lietuvių  magyar  Nederlands  norsk bokmål  norsk nynorsk  occitan  Plattdüütsch  polski  português  português do Brasil  română  Scots  sicilianu  slovenčina  slovenščina  suomi  svenska  Tiếng Việt  Türkçe  vèneto  Ελληνικά  беларуская (тарашкевіца)  български  македонски  нохчийн  русский  српски / srpski  татарча/tatarça  українська  ქართული  հայերեն  বাংলা  தமிழ்  മലയാളം  ไทย  한국어  日本語  简体中文  繁體中文  עברית  العربية  فارسی  +/−
新SVG图片

摘要

描述
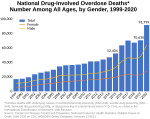
English: "Figure 1. National Drug-Involved Overdose Deaths—Number Among All Ages, by Gender, 1999-2020. Nearly 92,000 persons in the U.S. died from drug-involved overdose in 2020, including illicit drugs and prescription opioids. The figure above is a bar and line graph showing the total number of U.S. drug overdose deaths involving any illicit or prescription opioid drug from 1999 to 2020. The bars are overlaid by lines showing the number of deaths by gender from 1999 to 2020 (Source: CDC WONDER)."
日期 - date of first upload here to the Commons. See file history for date of latest upload.
来源 From Overdose Death Rates. By National Institute on Drug Abuse (NIDA). Click on the chart on the compilation page. The large chart will show up. Right-click it, and then "Open image in new tab" to get image URL. 1999-2021 chart. 1999-2020 chart. 1999-2019 chart. 2002-2017 chart. 1999-2017 chart. 2002-2015 chart.
作者 National Institute on Drug Abuse. Some of the charts were cropped to get rid of outer white space. The caption and legend text were edited in some charts. The edited charts were put under the same public domain license. See Commons:Convert tables and charts to wiki code or image files, and the section about removing, adding, and editing text on chart images.

许可协议

公有领域 這個圖像是美國衛生與公眾服務部下屬的美國國立衛生研究院的作品。作為美國聯邦政府的作品,這個圖像屬於公有領域
請確保此圖像實際上是由美國聯邦政府創建的。NIH經常使用非公共領域的商業圖像。

说明

添加一行文字以描述该文件所表现的内容
US timeline. Number of overdose deaths from all drugs.

此文件中描述的项目

描繪內容

image/jpeg

文件历史

点击某个日期/时间查看对应时刻的文件。

日期/时间缩⁠略⁠图大小用户备注
当前2023年7月12日 (三) 16:472023年7月12日 (三) 16:47版本的缩略图1,200 × 900(180 KB)TimeshifterLatest
2022年5月29日 (日) 21:212022年5月29日 (日) 21:21版本的缩略图1,200 × 900(153 KB)TimeshifterLatest version
2021年3月13日 (六) 16:272021年3月13日 (六) 16:27版本的缩略图1,106 × 524(130 KB)TimeshifterLatest version.
2019年8月16日 (五) 17:522019年8月16日 (五) 17:52版本的缩略图869 × 675(128 KB)TimeshifterNewer version.
2018年9月5日 (三) 15:322018年9月5日 (三) 15:32版本的缩略图813 × 583(96 KB)Timeshifternew version
2017年3月27日 (一) 11:422017年3月27日 (一) 11:42版本的缩略图840 × 643(103 KB)TimeshifterAdded border
2017年3月21日 (二) 02:172017年3月21日 (二) 02:17版本的缩略图837 × 641(96 KB)TimeshifterUser created page with UploadWizard

以下页面使用本文件:

全域文件用途

元数据