File:Timeline of US overdose deaths involving heroin, by other opioid involvement.jpg

本预览的尺寸:800 × 600像素。 其他分辨率:320 × 240像素 | 640 × 480像素 | 1,024 × 768像素 | 1,200 × 900像素。
原始文件 (1,200 × 900像素,文件大小:188 KB,MIME类型:image/jpeg)

|
File:US timeline. Heroin deaths.svg是此文件的矢量版本。 如果此文件质量不低于原点阵图,就应该将这个JPG格式文件替换为此文件。
File:Timeline of US overdose deaths involving heroin, by other opioid involvement.jpg → File:US timeline. Heroin deaths.svg
更多信息请参阅Help:SVG/zh。 |
 |
摘要
| 描述 |
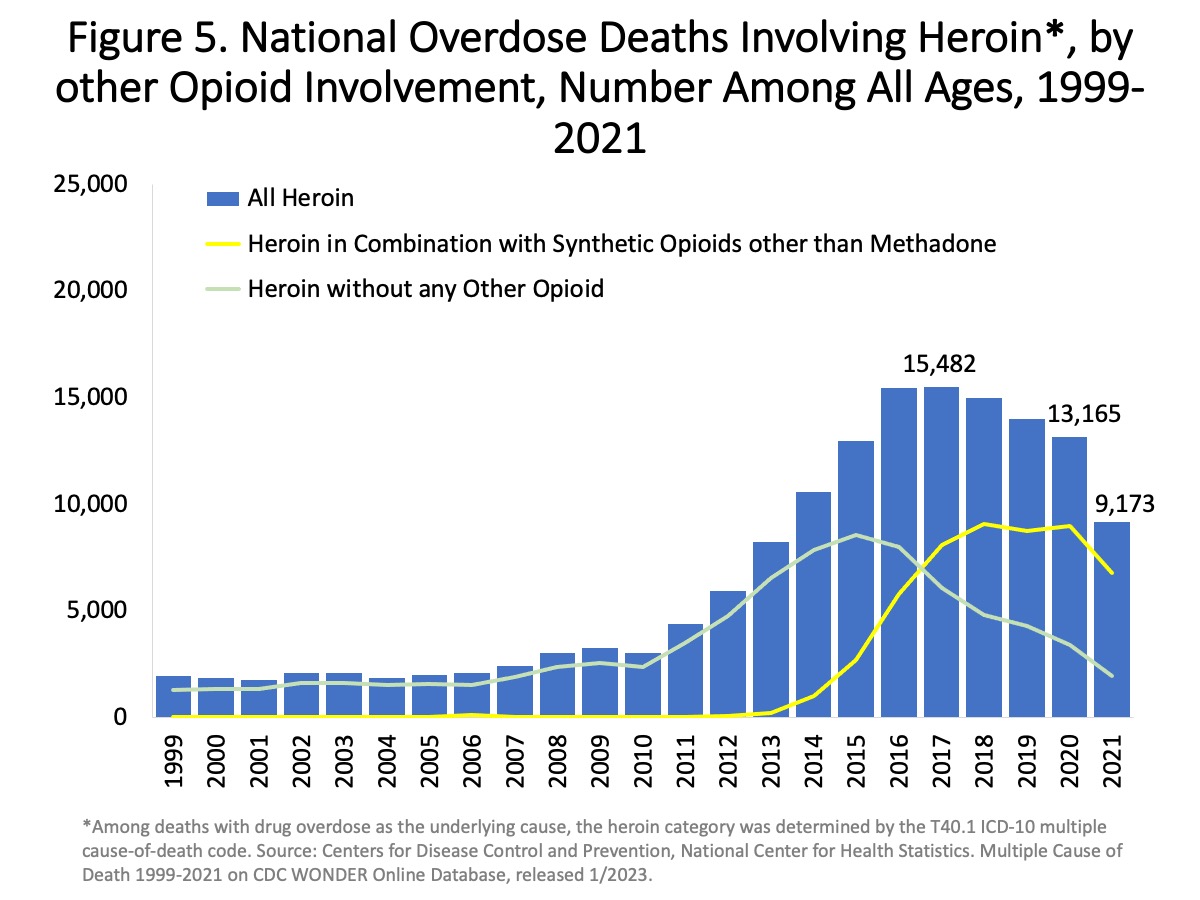
English: "Figure 5. National Overdose Deaths Involving Heroin, by Other Opioid Involvement—Number Among All Ages, 1999-2021. The figure above is a bar and line graph showing the total number of U.S. overdose deaths involving heroin from 1999 to 2021. Drug overdose deaths involving heroin rose from 1,960 in 1999 to 15,482 in 2017 before trending down to 13,165 deaths in 2020 and 9,173 deaths in 2021. The bars are overlaid by lines showing the number of deaths involving heroin in combination with synthetic opioids other than methadone (primarily fentanyl) or without any other opioid from 1999 to 2021 (Source: CDC WONDER)." |
| 日期 | - date of first upload to the Commons. See file history for dates of later uploads. |
| 来源 | Overdose Death Rates. By National Institute on Drug Abuse (NIDA). 1999-2021 chart. 1999-2019 chart. 2002-2017 chart. 2002-2015 chart. 2001-2014 chart. |
| 作者 | National Institute on Drug Abuse. Some versions of the chart were cropped, and have had "USA" added to them. Freeware IrfanView, etc. can be used. See Commons:Convert tables and charts to wiki code or image files, and the section about adding text to chart images. |
许可协议
此圖像為美國衛生與公眾服務部下屬國家衛生院(NIH)僱員於公務中所拍攝或製作之作品。作為美國聯邦政府的作品,此圖像屬於公有領域。
 |
||
| 本文件已被确认为免除已知的著作权法限制(包括所有相关权利)。 | ||
文件历史
点击某个日期/时间查看对应时刻的文件。
| 日期/时间 | 缩略图 | 大小 | 用户 | 备注 | |
|---|---|---|---|---|---|
| 当前 | 2023年7月22日 (六) 00:00 | | 1,200 × 900(188 KB) | Timeshifter | Latest |
| 2021年8月31日 (二) 08:52 |  | 1,150 × 865(184 KB) | Timeshifter | Latest chart from source. | |
| 2018年9月6日 (四) 15:23 |  | 810 × 589(94 KB) | Timeshifter | newer chart | |
| 2017年3月27日 (一) 10:51 |  | 794 × 636(91 KB) | Timeshifter | 2015 column. | |
| 2016年1月1日 (五) 11:11 |  | 791 × 586(84 KB) | Timeshifter | User created page with UploadWizard |
文件用途
全域文件用途
以下其他wiki使用此文件:
- ar.wikipedia.org上的用途
- en.wikipedia.org上的用途
- es.wikipedia.org上的用途
- hy.wikipedia.org上的用途
- ja.wikipedia.org上的用途
- sr.wikipedia.org上的用途
- vi.wikipedia.org上的用途