File:3 phase rectification 2.svg

原始文件(SVG文件,尺寸为624 × 943像素,文件大小:120 KB)


摘要

描述
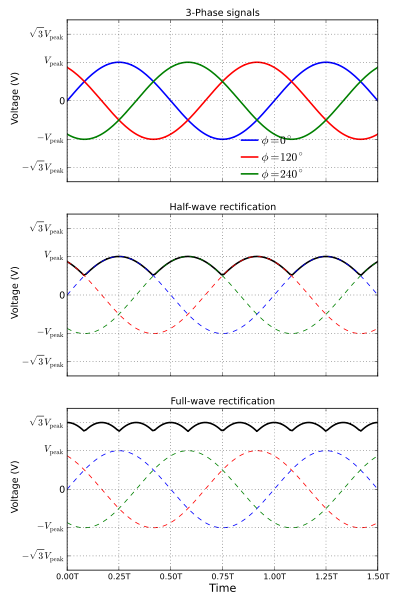
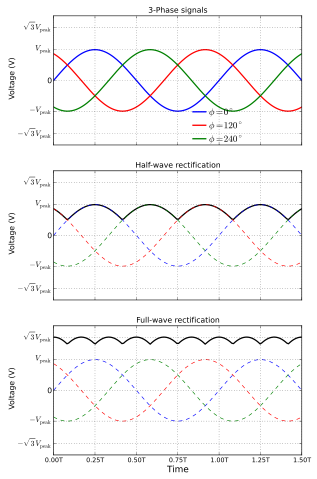
English: Waveforms for a typical 3-phase half-wave and full-wave rectifiers. The top plot shows the individual three phase signals, the middle plot shows the half-wave rectifier output in solid curve and the bottom plot shows the full-wave rectifier output in solid curve. The 'T' in time is the time period of individual signals and is the amplitude of each of the three input signals. The diagram was created using python, matplotlib and numpy.
Русский: Формы сигналов трёхфазного одно- и двухполупериодного выпрямителей. Сверху - отдельные трехфазные сигналы, средний график - выход однополупериодного выпрямителя сплошной линией, нижний график - выходной сигнал двухполупериодного выпрямителя сплошной линией. T - период, U - напряжения.
日期
来源 自己的作品
作者 Krishnavedala
其他版本

3 phase rectification 2.png [编辑]


.svg:

.png:

.jpg:

SVG开发
InfoField
W3C grn 
SVG的源代码为有效代码
Created with Matplotlib-logo 
矢量图使用Matplotlib创作。
源代码
InfoField

Python code

Source code
from matplotlib.pyplot import *
from numpy import *

f, Vpeak, cycles = 50., 1., 1.5
fs, Tlim = 2.*f, cycles/f
Vavg, Vrms = Vpeak*2./pi, Vpeak/sqrt(2.)
t = linspace(0,Tlim,fs*cycles)
w = 2.*pi*f # 50Hz AC
signal = lambda x,p: sin(w*x+p*2.*pi/3.)
def halfWave(time):
        s1, s2, s3 = signal(time,0.), signal(time,1.), signal(time,2.)
        if s1 > s2 and s1 > s3:
                if s2 > s3:
                        return s1, s2
                else:
                        return s1, s3
        elif s2 > s1 and s2 > s3:
                if s1 > s3:
                        return s2, s1
                else:
                        return s2, s3
        else:
                if s1 > s2:
                        return s3, s1
                else:
                        return s3, s2
 
def fullWave(time):
        s1, s2, s3 = abs(signal(time,0.)), abs(signal(time,1.)), \
                abs(signal(time,2.))
        if s1 > s2 and s1 > s3:
                if s2 > s3:
                        return s1, s2
                else:
                        return s1, s3
        elif s2 > s1 and s2 > s3:
                if s1 > s3:
                        return s2, s1
                else:
                        return s2, s3
        else:
                if s1 > s2:
                        return s3, s1
                else:
                        return s3, s2

xTickPts = []
for time in t:
        s1, s2, s3 = abs(signal(time,0.)), abs(signal(time,1.)), \
                abs(signal(time,2.))
        if s1 == s2:
                xTickPts = append(xTickPts, time)
                print time
        elif s2 == s3:
                xTickPts = append(xTickPts, time)
                print time
        elif s3 == s1:
                xTickPts = append(xTickPts, time)
                print time
 
def myAxes(this):
        this.grid(True)
        this.set_xlim(0,Tlim)
        this.set_xticks(arange(0,cycles+.25,.25)/f)
        this.set_xticklabels([])
        this.set_ylabel(r"Voltage (V)",fontsize=12)
	this.set_ylim(-2.*Vpeak-.1,2.*Vpeak+.1)
	this.set_yticks([-1.73*Vpeak,-Vpeak,0,Vpeak,1.73*Vpeak])
	this.set_yticklabels([r"$-\sqrt{3}V_{\mathrm{peak} }$",r"$-V_{\mathrm{peak} }$",\
        	r"0",r"$V_{\mathrm{peak} }$",r"$\sqrt{3}V_{\mathrm{peak} }$"])

fig = figure(figsize=(7,12))
ax = fig.add_subplot(311)
ax.plot(t,signal(t,0),'b',linewidth=2,label=r"$\phi=0^\circ$")
ax.plot(t,signal(t,1),'r',linewidth=2,label=r"$\phi=120^\circ$")
ax.plot(t,signal(t,2),'g',linewidth=2,label=r"$\phi=240^\circ$")
myAxes(ax)
ax.set_title(r'3-Phase signals',fontsize=12)
ax.legend(loc=1, \
        bbox_to_anchor=(.8,.35),\
        frameon=False,handletextpad=.05)

ax = fig.add_subplot(312)
S, H = [], []
for time in t:
        s, h = halfWave(time)
        S = append(S,s)
        H = append(H,h)
ax.plot(t,S,'k',linewidth=2.)
ax.plot(t,signal(t,0),'b--',linewidth=1.)
ax.plot(t,signal(t,1),'r--',linewidth=1.)
ax.plot(t,signal(t,2),'g--',linewidth=1.)
myAxes(ax)
ax.set_title(r"Half-wave rectification", fontsize=12) 
 
ax = fig.add_subplot(313)
S, H = [], []
for time in t:
        s, h = fullWave(time)
        S = append(S,s)
        H = append(H,h)
ax.plot(t,S+H,'k',linewidth=2.)
ax.plot(t,(signal(t,0)),'b--',linewidth=1.)
ax.plot(t,(signal(t,1)),'r--',linewidth=1.)
ax.plot(t,(signal(t,2)),'g--',linewidth=1.)
myAxes(ax)
ax.set_title(r"Full-wave rectification", fontsize=12) 
 
myLabel = []
for i in arange(0,cycles+.25,.25):
   myLabel = append(myLabel,r"%.2fT"%i)
#    myLabel = append(myLabel,r"${}^{%.1fT}_{\pi/%.1f}$"%(i,(i*2)))
 
ax.set_xticklabels(myLabel,fontsize=10)
ax.set_xlabel(r"Time",fontsize=14)
 
#fig.suptitle("3-phase AC rectification",fontsize=16)
 
fig.savefig("3_phase_rectification_2.svg",bbox_inches="tight",\
        pad_inches=.15)

许可协议

我,本作品著作权人,特此采用以下许可协议发表本作品:
w:zh:知识共享
署名 相同方式共享
您可以自由地:
  • 共享 – 复制、发行并传播本作品
  • 修改 – 改编作品
惟须遵守下列条件:
  • 署名 – 您必须对作品进行署名,提供授权条款的链接,并说明是否对原始内容进行了更改。您可以用任何合理的方式来署名,但不得以任何方式表明许可人认可您或您的使用。
  • 相同方式共享 – 如果您再混合、转换或者基于本作品进行创作,您必须以与原先许可协议相同或相兼容的许可协议分发您贡献的作品。
GNU head 已授权您依据自由软件基金会发行的无固定段落及封面封底文字(Invariant Sections, Front-Cover Texts, and Back-Cover Texts)的GNU自由文件许可协议1.2版或任意后续版本的条款,复制、传播和/或修改本文件。该协议的副本请见“GNU Free Documentation License”。
您可以选择您需要的许可协议。

说明

添加一行文字以描述该文件所表现的内容

此文件中描述的项目

描繪內容

image/svg+xml

81710e35a0295fce57872446b59671e4654e7476

122,572 字节

943 像素

624 像素

文件历史

点击某个日期/时间查看对应时刻的文件。

最新 | 最旧) 查看(较新10条 | )(10 | 20 | 50 | 100 | 250 | 500
日期/时间缩⁠略⁠图大小用户备注
当前2011年9月23日 (五) 15:522011年9月23日 (五) 15:52版本的缩略图624 × 943(120 KB)Krishnavedalaindividual plots are now consistent with each other
2011年9月22日 (四) 17:242011年9月22日 (四) 17:24版本的缩略图624 × 943(114 KB)Krishnavedalafinal correction, hopefully!!
2011年9月22日 (四) 17:202011年9月22日 (四) 17:20版本的缩略图640 × 943(116 KB)Krishnavedalacorrected Time coordinates
2011年9月22日 (四) 17:042011年9月22日 (四) 17:04版本的缩略图623 × 943(115 KB)KrishnavedalaCorrected the waveforms for the full wave rectification.
2011年6月30日 (四) 22:062011年6月30日 (四) 22:06版本的缩略图599 × 944(175 KB)SpinningsparkFixed correct use of italics. Fixed annotation outside boundary of image. Output waveform on top of input waveforms.
2011年6月30日 (四) 19:292011年6月30日 (四) 19:29版本的缩略图599 × 944(111 KB)Krishnavedalaremoved "(sec)" from the x-axis label
2011年6月30日 (四) 19:272011年6月30日 (四) 19:27版本的缩略图599 × 946(111 KB)Krishnavedalaedits from suggestions in here
2011年6月17日 (五) 19:512011年6月17日 (五) 19:51版本的缩略图524 × 874(142 KB)Krishnavedalathinner dashed lines
2011年6月17日 (五) 19:482011年6月17日 (五) 19:48版本的缩略图524 × 874(142 KB)Krishnavedalaall plots on the same scale to avoid confusion
2011年6月8日 (三) 17:182011年6月8日 (三) 17:18版本的缩略图594 × 946(223 KB)Krishnavedalacorrection in the labels
最新 | 最旧) 查看(较新10条 | )(10 | 20 | 50 | 100 | 250 | 500

以下页面使用本文件:

全域文件用途

以下其他wiki使用此文件: